
AT Risk indicator Plus
Attendance
+ 25 day Rolling
+ Tardy / Suspensions
and Streaks!
Hours logged : 10
Estimated Date : LAte 2025
This will be the First Build that works completely indenpendantly of SYSTEM or Software.
The Goal of this project is to create a customizable scoring system layered ontop of attendances and intervention data.
Attendance
This is your regular attendance data ( excused vs unexcused, Attendance % )
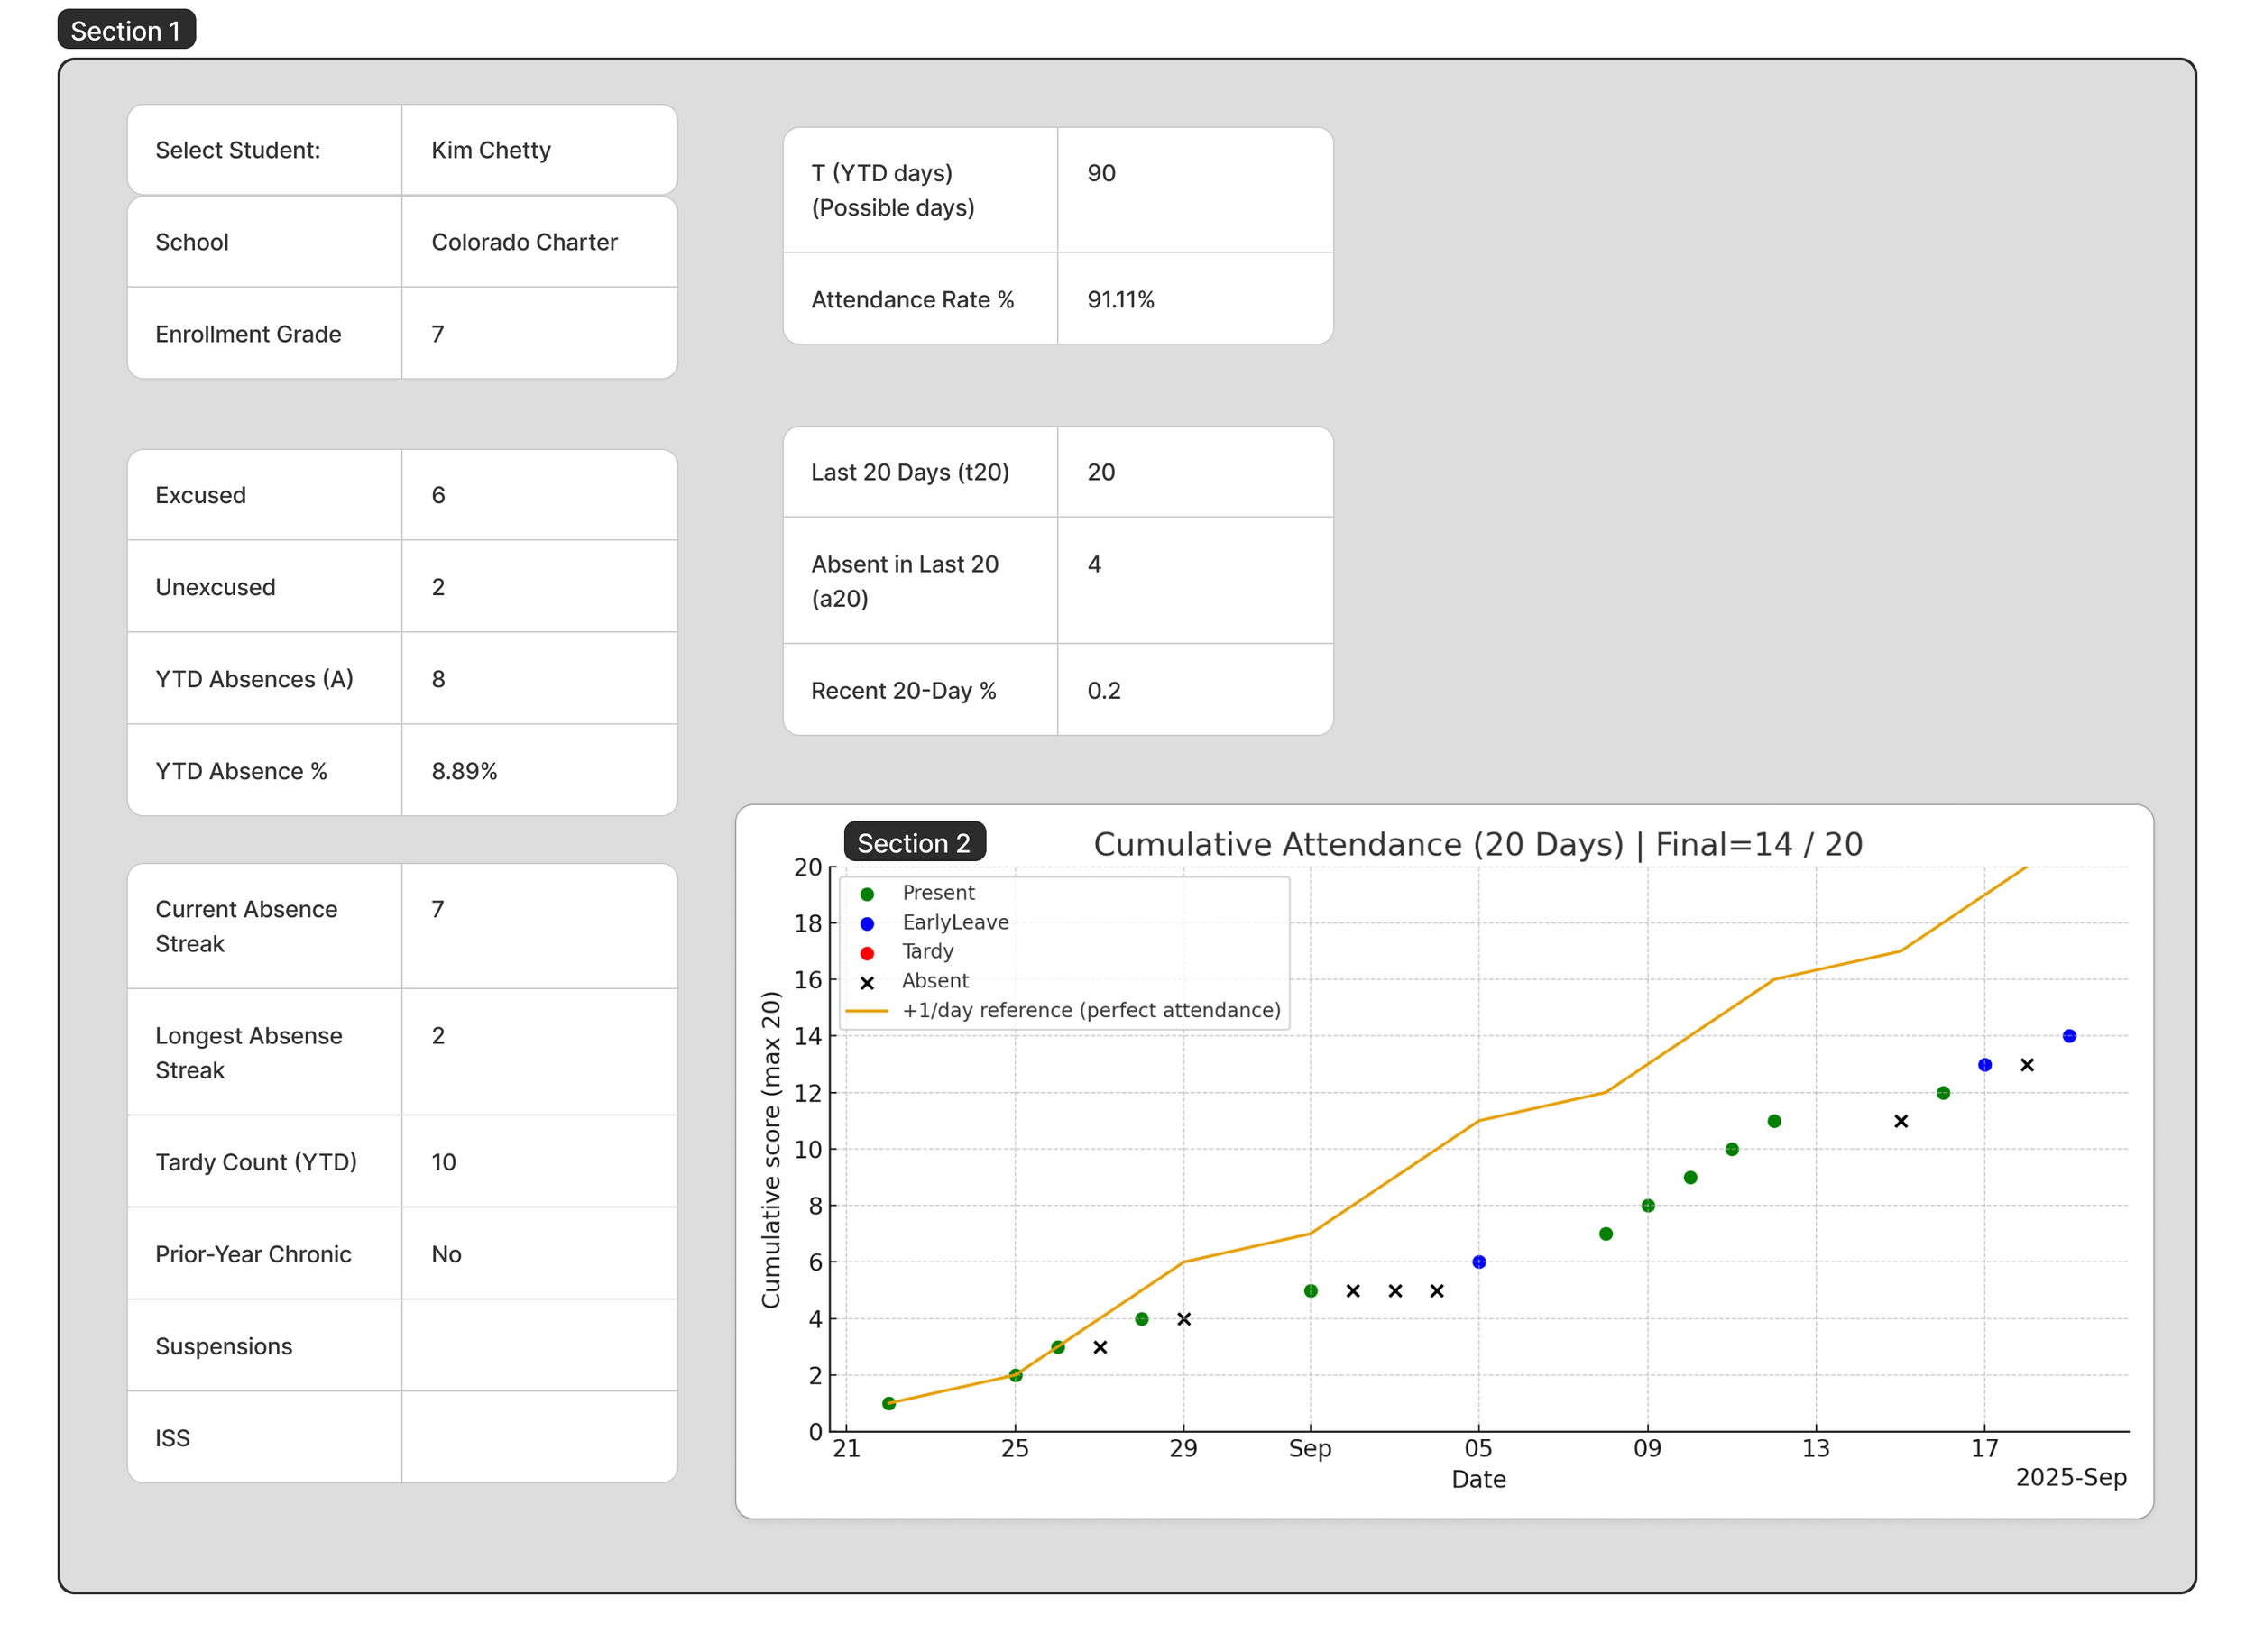
25 Day Rolling
This is much more complex but will result in a simple chart for at a glance decision making. Seeing the last 25 days paints a much deep and rich painting when you include other data points.
Tardy / Suspensions AND STREAKS
Bringing a lil 2025 tech to chronic absentieum .. I thought adding a 3/5/8/10 streaks indicator would make the data more digestable.
Master Table
| Field | Raw / Helper | Description |
|---|---|---|
| Instructional days possible (IDP) | RAW | number of school days the student could attend (exclude unenrolled days). |
| Excused Absences | RAW | |
| Unexcused Absences | RAW | |
| Days absent (DA) | Helper | excused + unexcused (track separately too). |
| Attendance rate (AR) | Helper | AR = 1 – DA/IDP. |
| Chronic absence (CA) | Helper | missing ≥10% of IDP (some districts also track severe at ≥20%). |
Sprinkle in Some SIS Data
| Field | Raw / Helper | Description |
|---|---|---|
| student_id | RAW | |
| school_id | RAW | |
| Enrollment grade | RAW | |
| school_day (instructional date) | Helper | |
| attendance_status | Helper | (Present / Absent / Tardy / EarlyLeave; keep your district’s exact codes) |
| excused_flag | Helper | (Y/N) and absence_reason (illness, transport, etc.) |
| enrolled_flag | Helper | (Y/N) to exclude unenrolled days from denominators Reference/rollup inputs |
| year_start_date | ||
| as_of_date | T = YTD instructional days possible (enrolled days through as_of_date) | |
| instructional_calendar | (which days count) | |
| prior_year_chronic_flag | Y/N per student; or prior-year absences + days possible |
These are the Big BRain concepts
Feature engineering (transparent math)
Let:
- T = YTD instructional days possible (enrolled days through as_of_date)
- A = YTD absences (excused + unexcused; you can also track separately)
- t20 = recent window length (e.g., last 20 instructional days actually attended/available)
- a20 = absences in last t20 days
- streak_abs = longest current consecutive-absence streak (ending at as_of_date)
- tardy_cnt = YTD count of tardies
- prior_year_chronic_flag = 1 if prior-year chronic (≥10%), else 0
Derived rates:
- YTD absence rate: rytd = A / T
- Recent-20 absence rate: r20 = a20 / t20
- Tardy-to-absence ratio: ρ = tardy_cnt / max(A, 1)
(Rationale: chronic students often show rising tardies before/with absences.)
Student Data and some helper columns for QA
Risk scoring that's simple but powerful
Create a transparent risk index (0–100) combining a few variables that consistently predict chronicity:
-
YTD absence % (scaled 0–40 pts)
-
Recent 25-day absence % (0–25 pts)
-
Consecutive absences streak (0–15 pts) (e.g., ≥3 days in a row)
-
Tardies-to-absences ratio (0–10 pts) (high tardy rate often precedes absences)
-
Prior-year chronic flag (0–10 pts)